Kids Visualizing Data
-
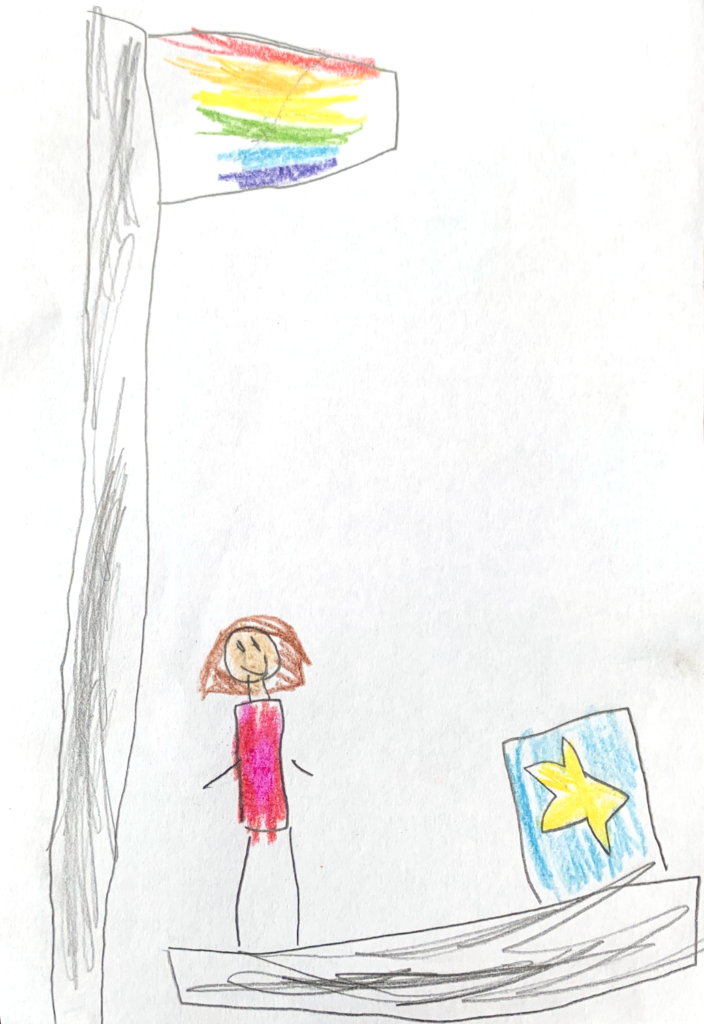
Visualized by Mina, Age 6 COMPLAINT: “City flag missing and replaced with LBG flag.”
-
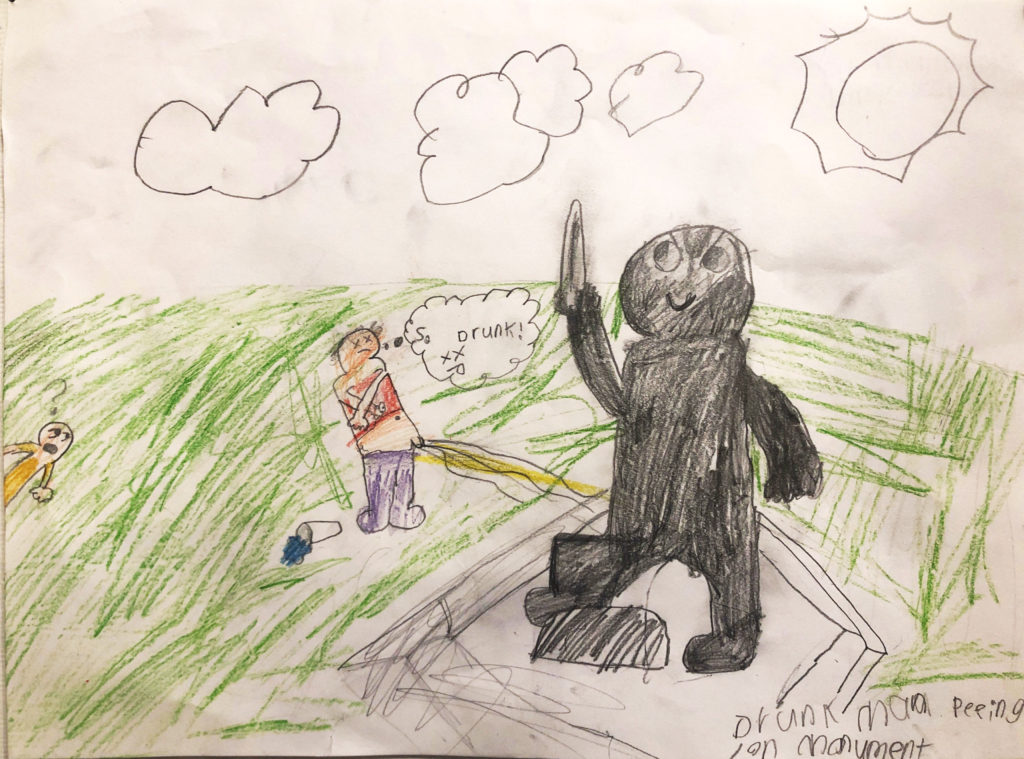
Visualized by Ernest, Age 8 COMPLAINT: “Drunk man peeing on monument”
-

Visualized by Analiese, Age 9 COMPLAINT:“Numerous rodent sightings by Patrons”
-

Visualized by Eva, Age 6 COMPLAINT:“Turkeys in plgd.”
-
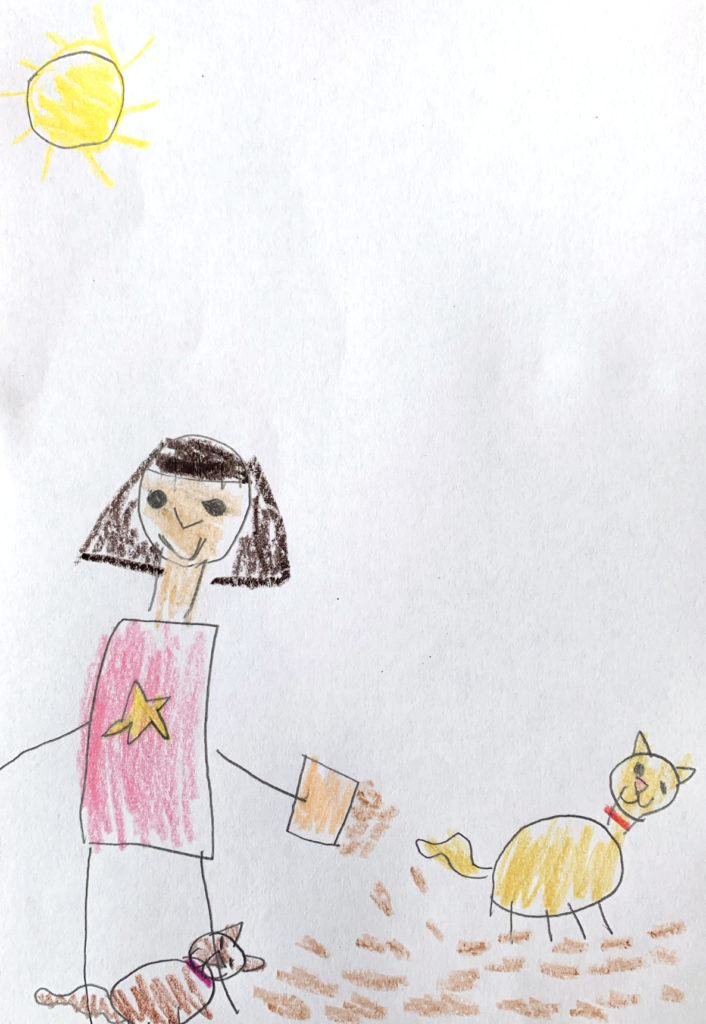
Visualized by Mina, Age 6 COMPLAINT: “Woman pouring cat food onto pavement adj WIF along HRD.”
-
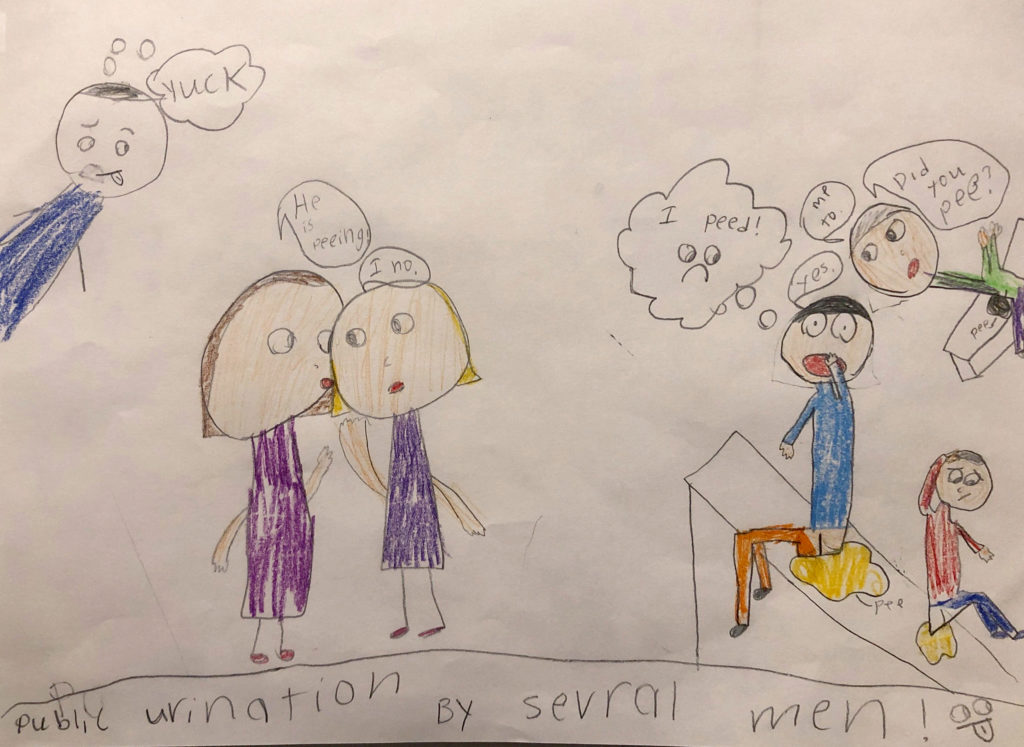
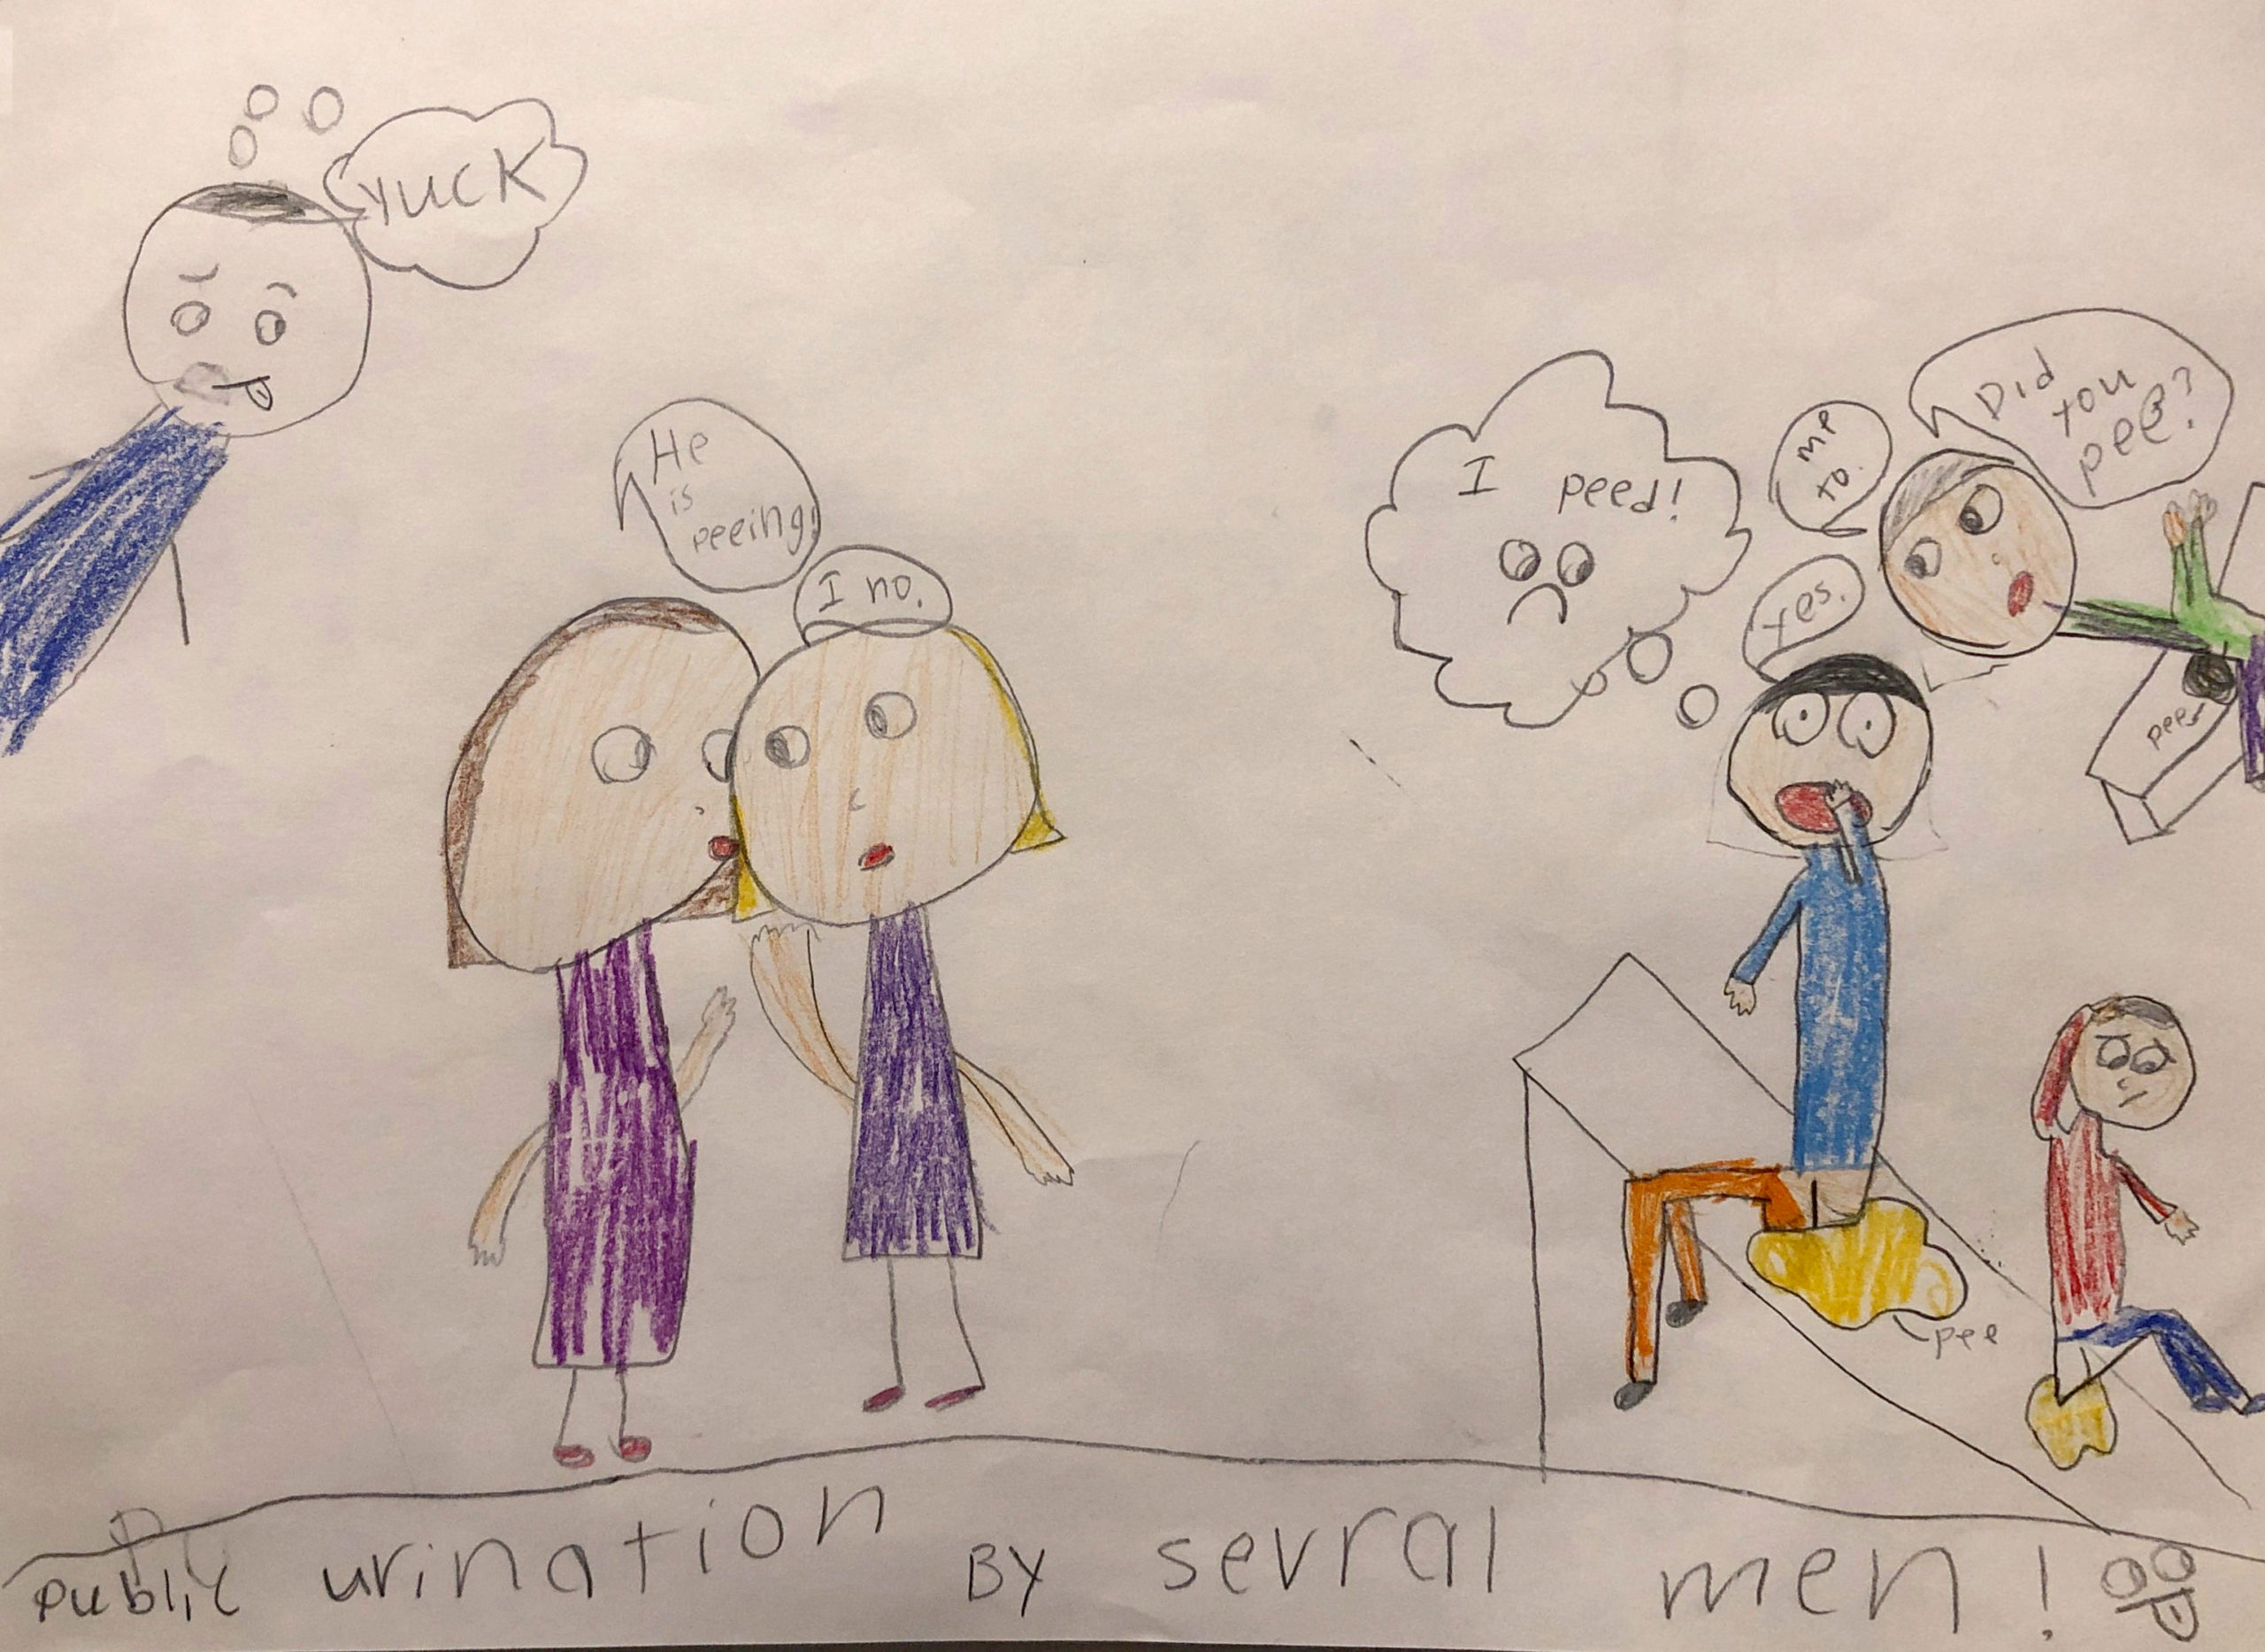
Visualized by Elise, Age 8 COMPLAINT:“Public urination by several men”
-
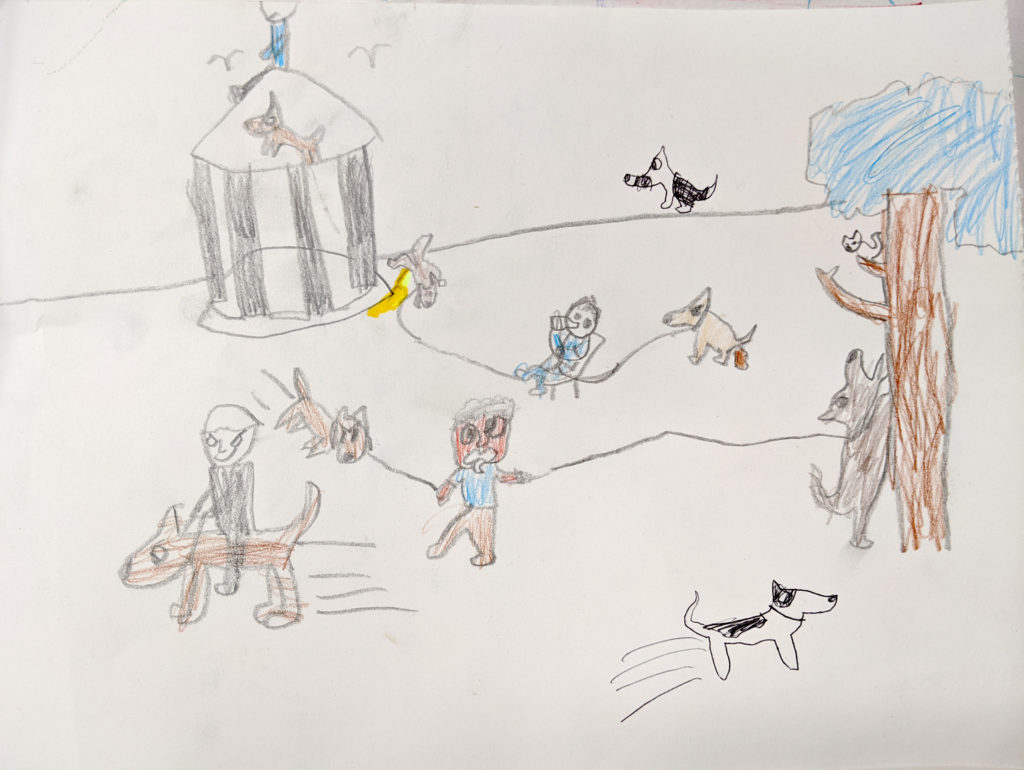
Visualized by Rae, Age 9 COMPLAINT: “Hockey rink being used as a dog run.”
-
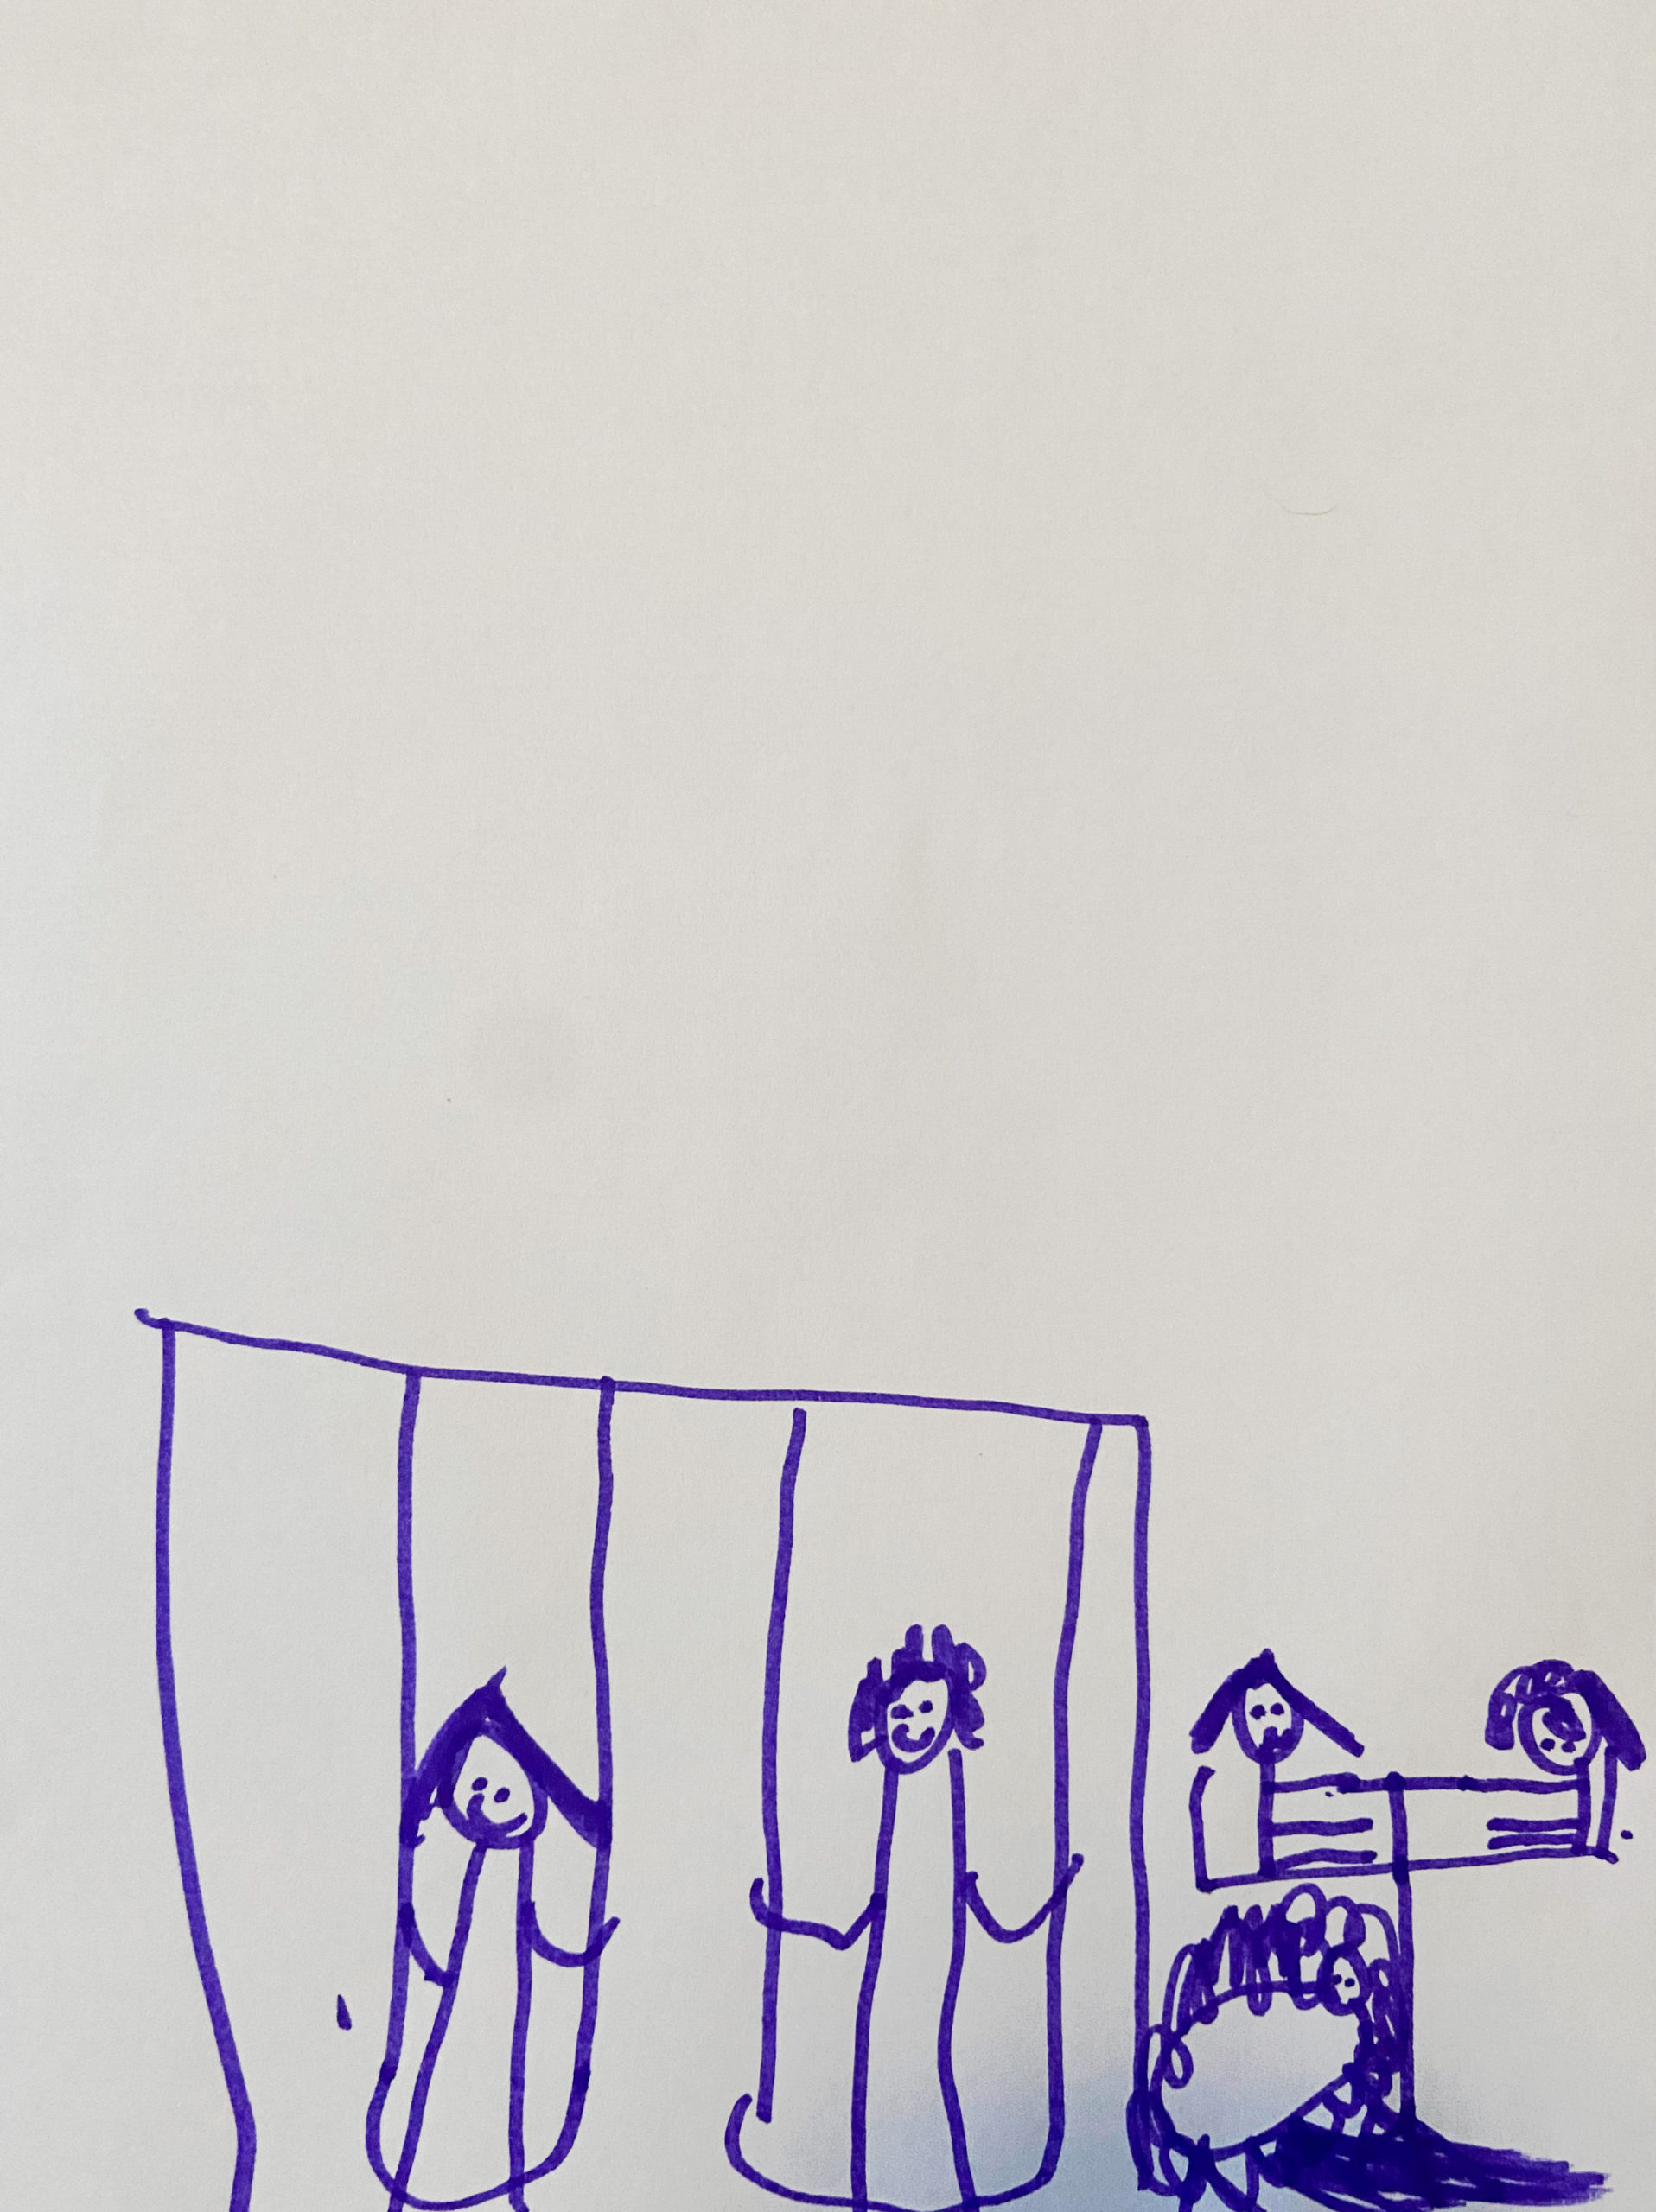
Visualized by Iona: Age 5 – COMPLAINT:“Playground was overcrowded.”
-
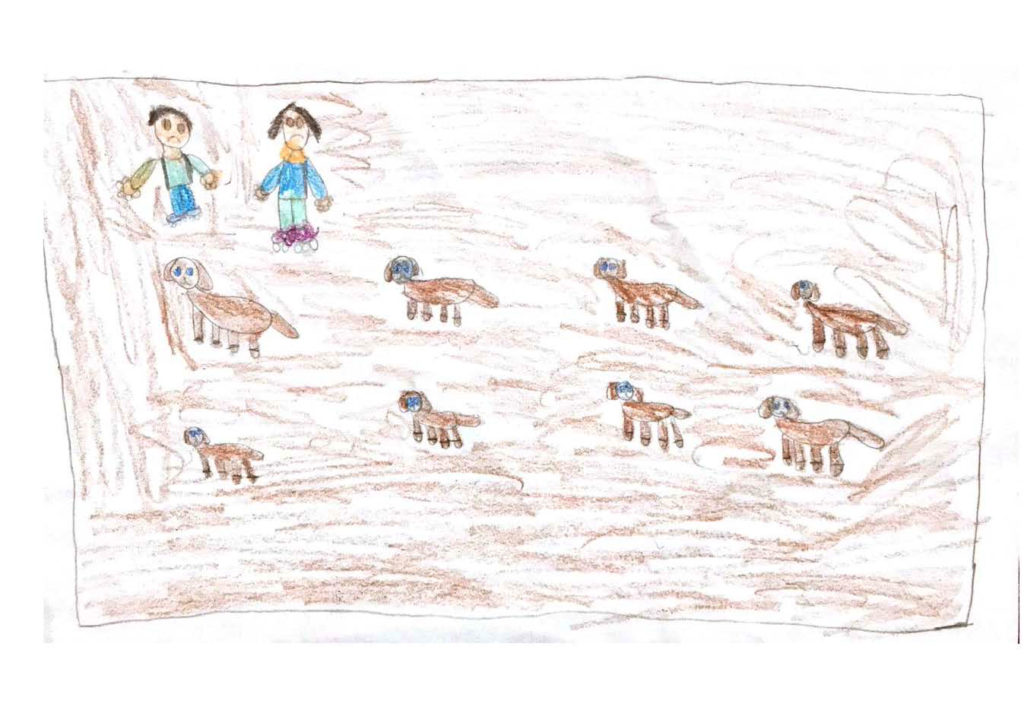
Visualized by Otto, Age 9 COMPLAINT: “near Gazebo about four men and 8 big dogs just running wild”


Through our discussions, we also recognize that the data itself – outside the gloom and doom – also has potential for joy. We culled the NYC Park Complaint database for entries that were outliers; either worded in amusing ways, farcically lacking in empathy, or in some other way “funny.” We then offered these captions to children to illustrate. This gallery – although not featured in the video – showcases their data visualizations. For me, allowing children to present the data is akin to inviting them to use the props in the video; it’s a process of responsive collaboration. Working with children, new possibilities of ‘playing with data’ emerge – introducing their viewpoints that were lacking in the original datasources.